Week 2 Recap: Databases, Scaling, and Cost
Week 2 is done. Seven posts, and one question kept coming back in different forms: what are you actually paying for, and is it doing the job you think it is?
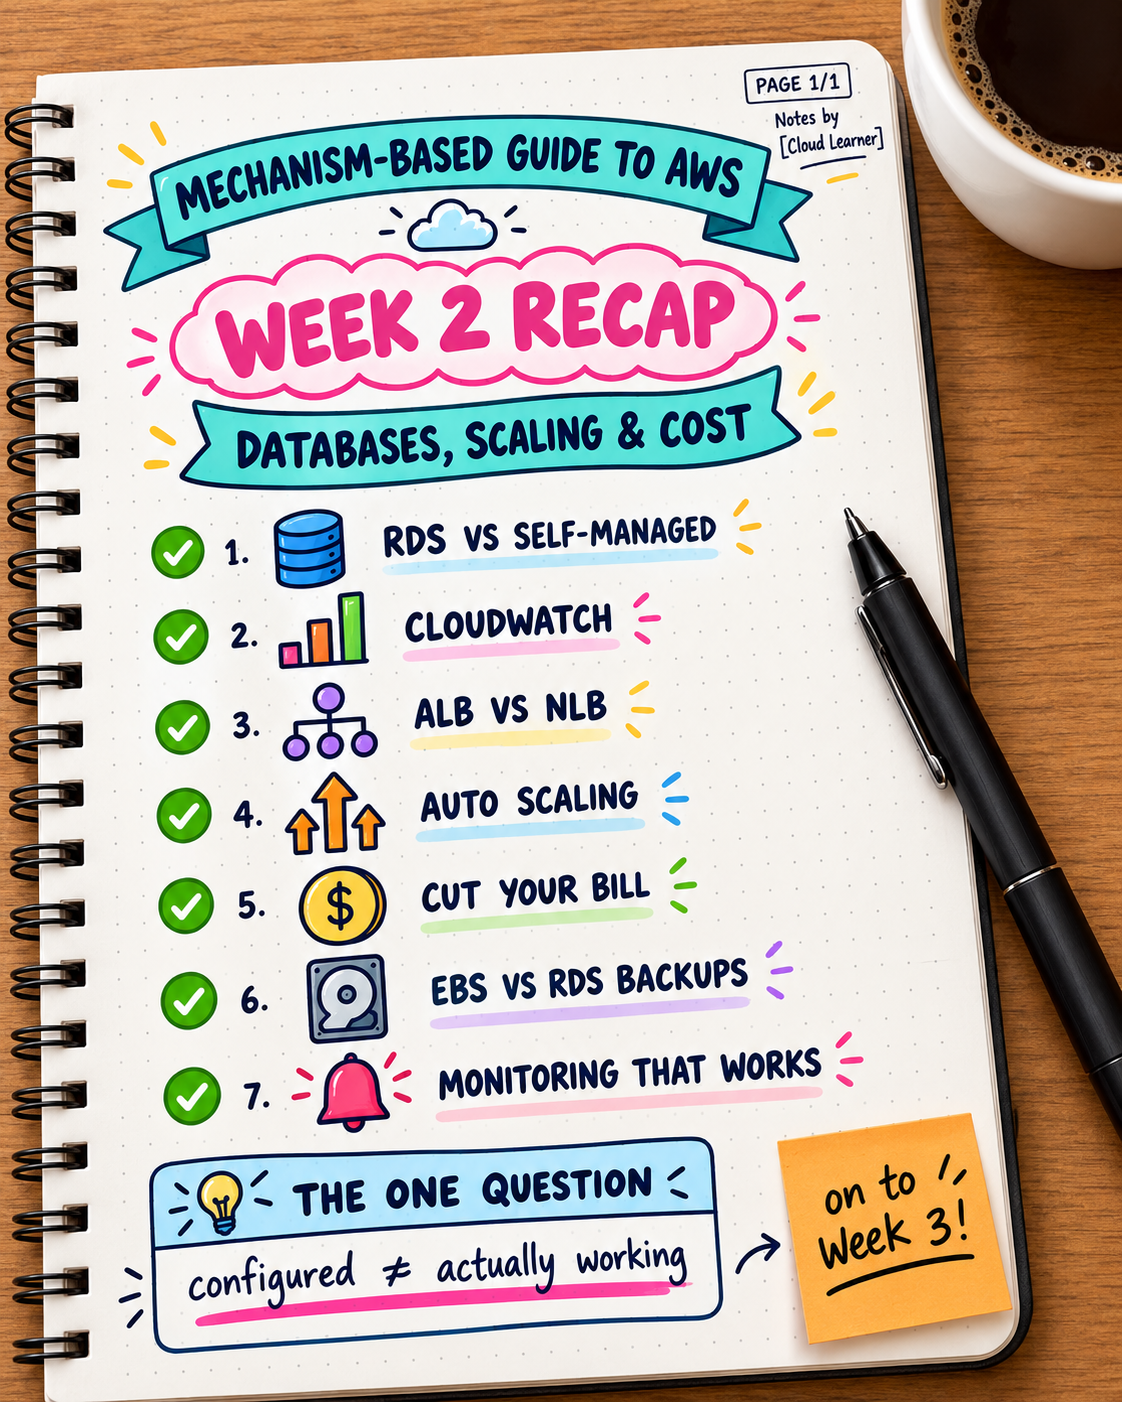
Day 8 — RDS vs Self-Managed Database on EC2 RDS handles backups, patching, Multi-AZ failover, and read replicas. Self-managing buys OS-level control and custom extensions, at the cost of owning all of that yourself. RDS costs more per hour, but usually less than the labor and risk of replicating its automation correctly.
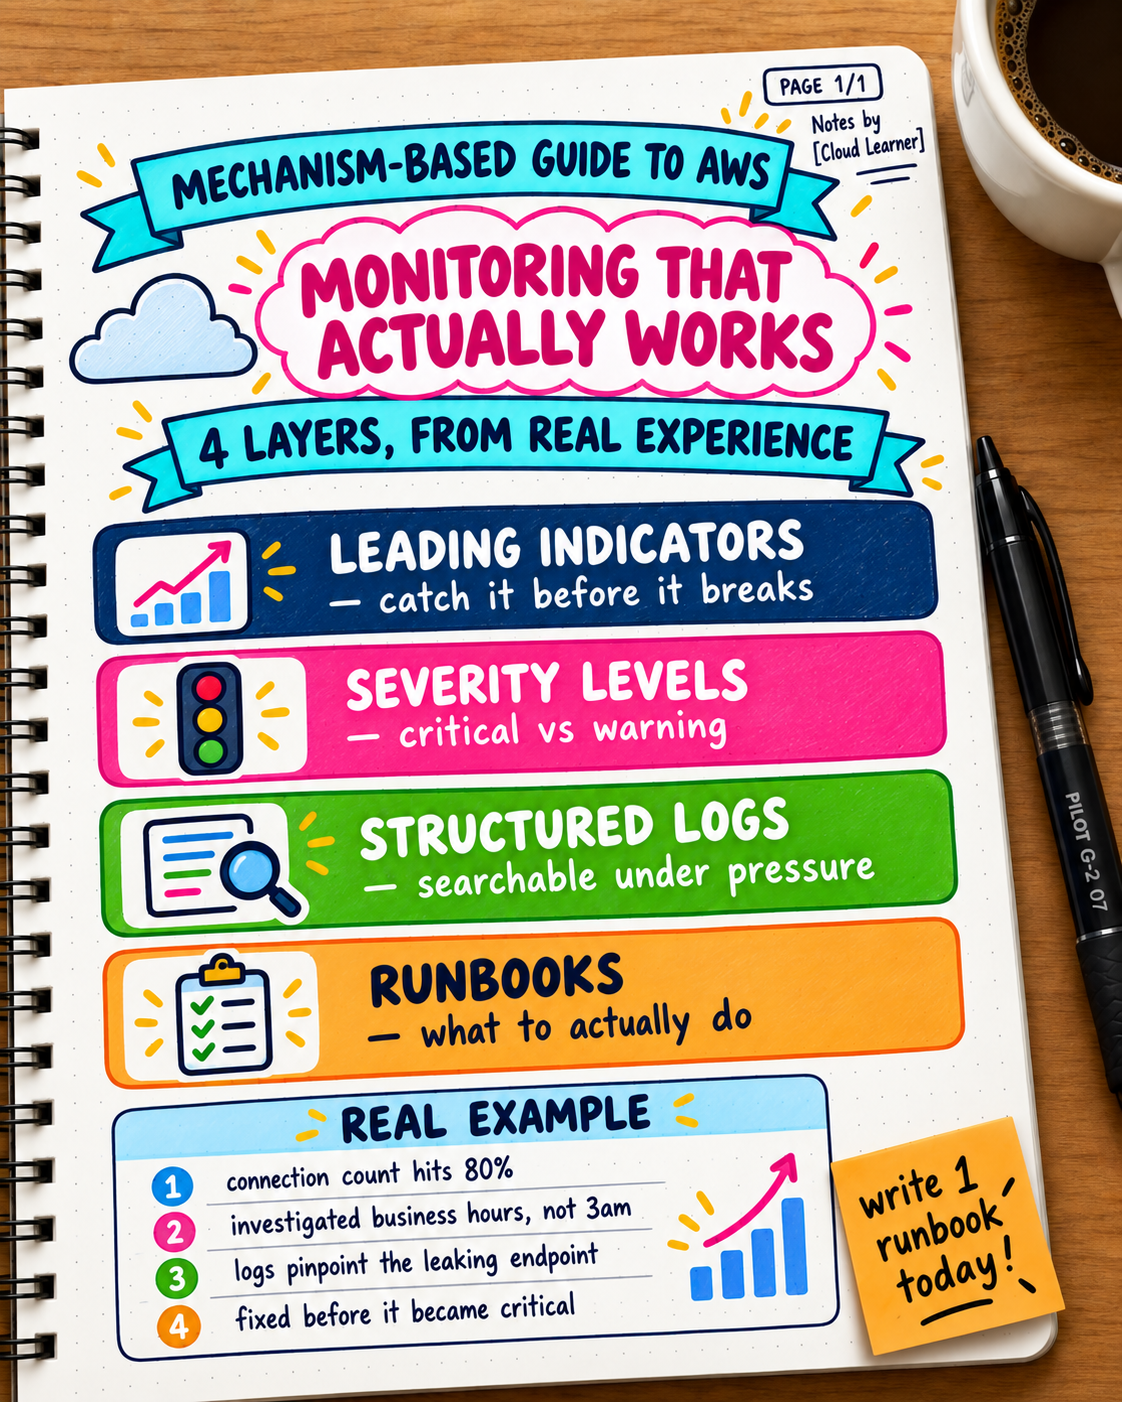
Day 9 — CloudWatch Explained Metrics show what's happening, logs show why, alarms get someone's attention. Metrics without alarms means the data exists but nobody's notified. Log retention defaults to forever, which quietly costs money.
Day 10 — ALB vs NLB ALB works at Layer 7 and routes on HTTP content (path, host). NLB works at Layer 4, is faster, and supports static IPs. The right default for most web apps is ALB. NLB earns its place for raw throughput or a fixed IP.
Day 11 — Auto Scaling Groups Minimum, desired, and maximum define the boundaries. Scaling policies are really CloudWatch alarms that trigger an action. Scale out fast, scale in slow, or you get flapping. Health checks need to match your actual startup time.
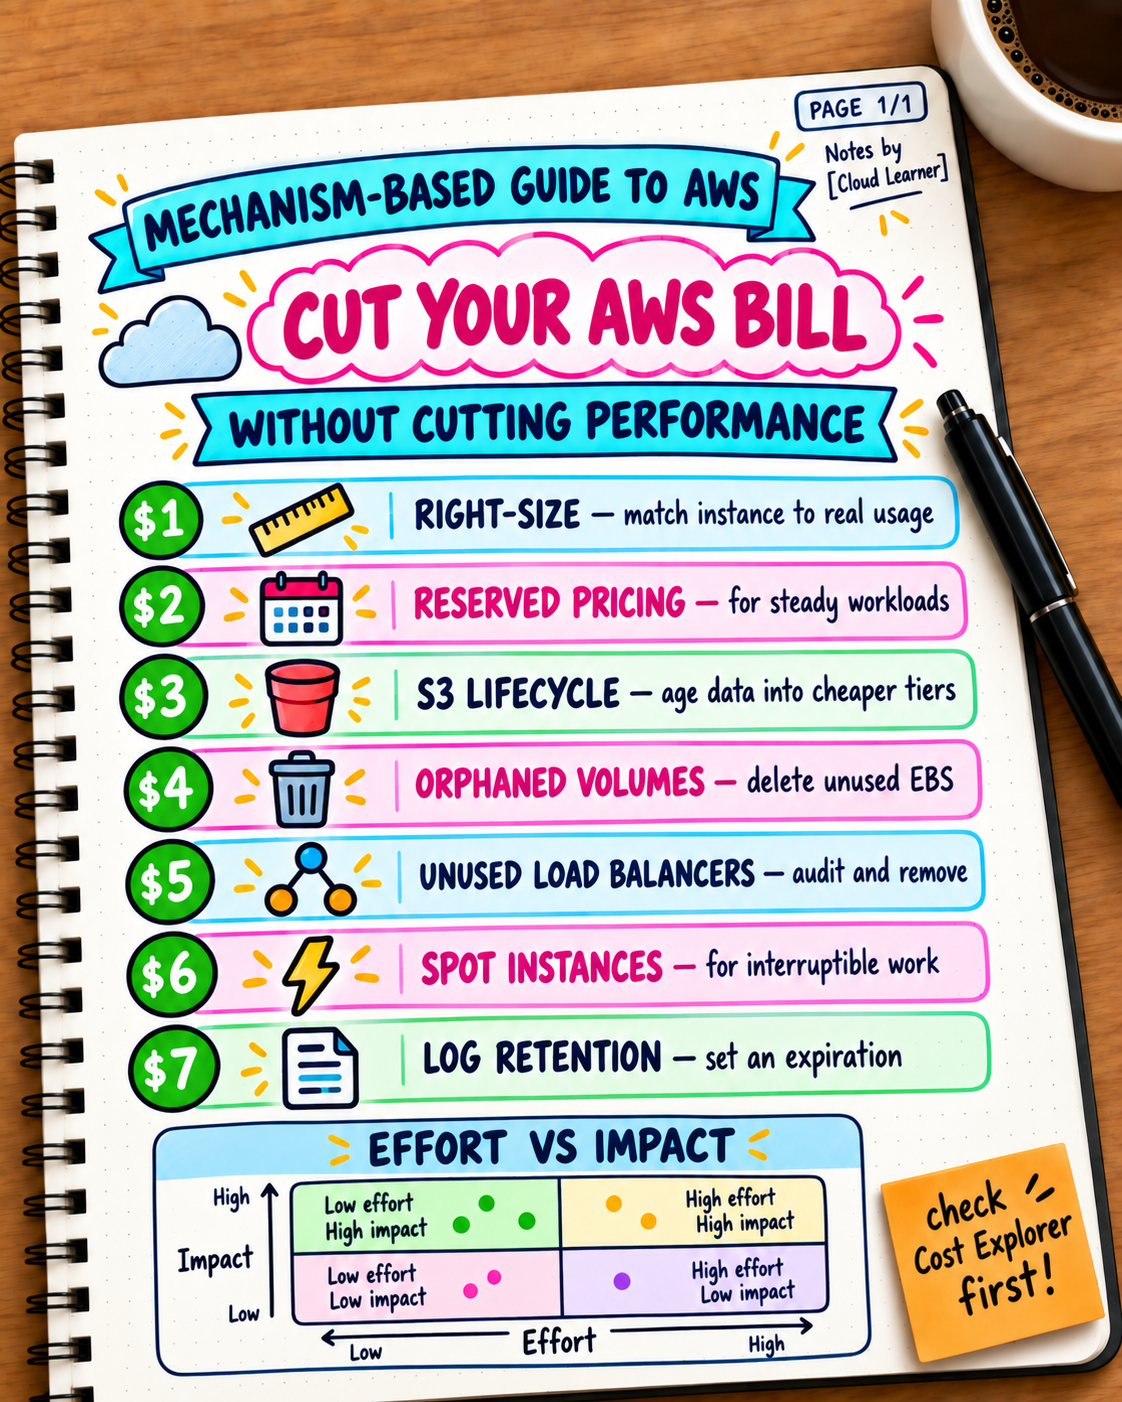
Day 12 — 7 Ways to Cut Your AWS Bill Right-sizing, Reserved pricing, S3 lifecycle policies, orphaned EBS volumes, unused load balancers, Spot Instances, and log retention. None of them reduce real capacity. They eliminate waste or change how you pay for the same resource.
Day 13 — EBS Snapshots vs RDS Backups EBS Snapshots are disk-level and crash-consistent. RDS Backups are database-aware and support point-in-time recovery to any second. A daily snapshot still means up to a day of potential data loss. Your recovery point objective is the number that matters.
Day 14 — Building a Monitoring Setup That Actually Works Four layers: leading-indicator alarms, severity levels, structured logs, and runbooks. The goal is surfacing the right signal to the right person before users notice, without needing anyone to watch a dashboard continuously.
The thread connecting all seven:
Almost every post this week was really about the gap between "this is configured" and "this is actually working." A database with backups isn't protected until you know the recovery window. An Auto Scaling Group isn't resilient until the thresholds and health checks fit your app. CloudWatch isn't monitoring until alarms exist. The setup is the easy part. Knowing what it actually guarantees is the work.
A genuine question before Week 3:
Week 3 moves into Route 53, CloudFront, Elastic Beanstalk, common costly mistakes, production support, and Multi-AZ vs Multi-Region. Which of Week 2's seven topics do you want a deeper, more hands-on follow-up on?
Takeaway: Seven posts, one pattern: AWS makes it easy to turn a feature on, and much harder to be sure it's protecting or optimizing what you assume it is. Check the actual numbers (recovery window, utilization, alarm coverage), not just that the setting exists.